Creator SaaS Pricing in 2026: What Scales, What Breaks
Introduction
Creator SaaS pricing hit a new phase in 2026. Growth is real, but so are layered fees, AI costs, and churn friction. For marketers and brand managers, the challenge is simple: pick a model that scales with usage without eroding trust or margins.
This guide decodes what works across subscriptions, revenue share, and hybrid, and where pricing breaks as teams add AI, community, and commerce.
The 2026 pricing reality: take rates and fee stacking
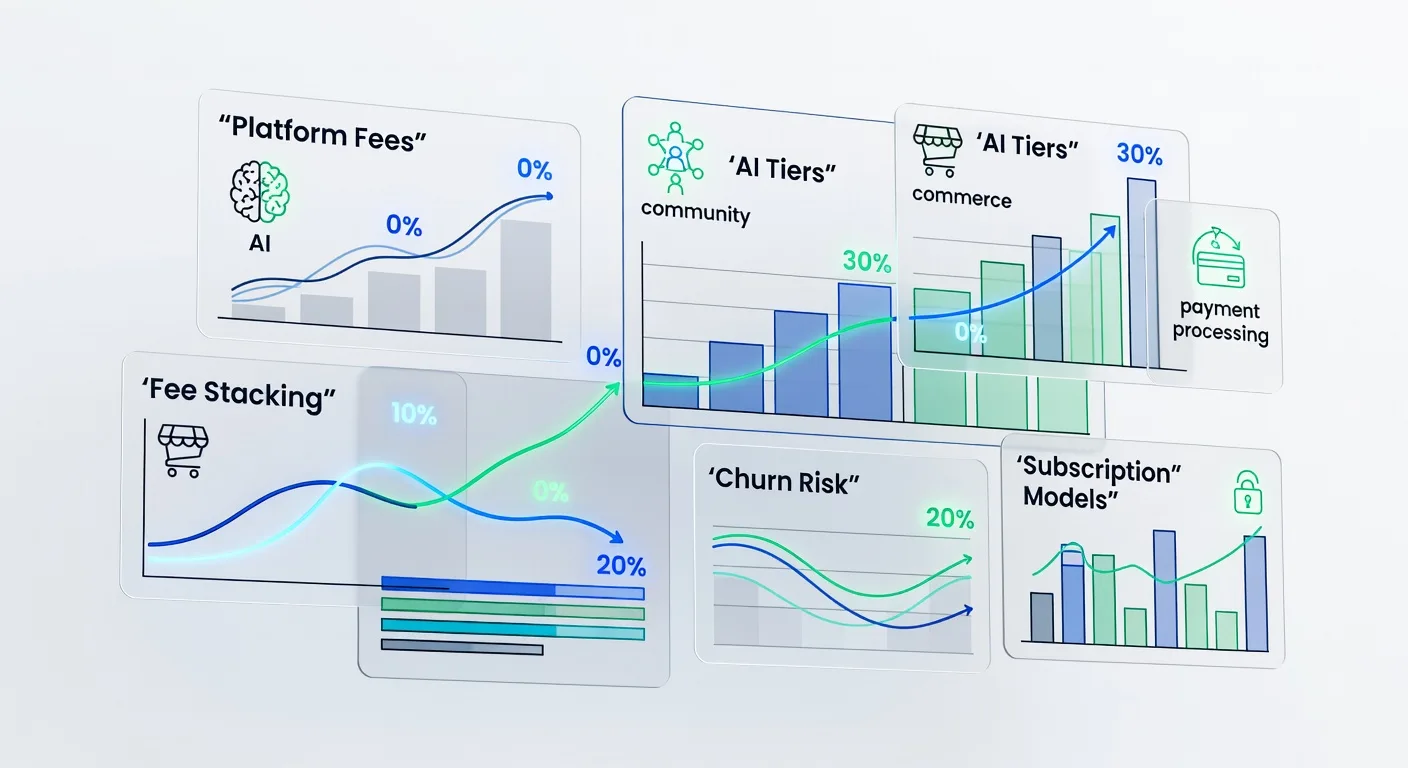
Platform fees in 2026 span 0% to 30%, with most direct sales landing between 3% and 10%. The headline number rarely tells the whole story.
Creators also pay payment processing, potential app‑store charges, currency conversion, and monthly software subscriptions.
On Patreon’s standard setup in 2026, add a 10% platform fee plus typical processing of 2.9% + $0.30, or 5% + $0.10 for micro‑transactions, currency conversion around 2.5%, and variable payout fees.
All‑in, many creators effectively lose 12%–15% of gross each month before taxes.
Substack stays at 10% plus Stripe fees, while Discord’s paid memberships confirm direct fan monetization has matured beyond ad revenue sharing.
For marketing teams, fee stacking affects pricing tests, bundle design, and partnership ROI. Model total cost of ownership, not just the platform’s sticker.
Subscriptions, revenue share, or hybrid?
Subscriptions shine when value is predictable and usage does not explode unit costs. Revenue share works when GMV scales and the vendor adds real conversion lift. Hybrids mix a lower platform fee with a modest monthly plan to align incentives.
Beehiiv leans subscription. In 2026, Launch is free up to 2,500 subscribers with unlimited sending; Scale starts around $49 at 1k and steps up by audience size; Max and Enterprise cover higher tiers.
Substack and Patreon, by contrast, monetize with a 10% take and processing on top. That simplicity helps small teams start, but fee stacking grows painful as revenues scale.
For brands running creator programs, hybrids can hedge: offer a reduced rev‑share plus a subsidized SaaS seat to secure preferred placement, co‑marketing, or data rights.
AI pricing in practice: seats, usage, and credits
In 2026, a majority of SaaS vendors launched AI‑premium tiers, and buyers budgeted materially more for features that speed research, writing, and asset creation. Packaging has split along two tracks.
Consumer products favor subscriptions with usage caps and overages. APIs and pro workflows sell credits or pure usage, pegged to tokens, renders, or minutes.
This dual model matches value to willingness to pay while protecting margins as inference costs fluctuate. For marketing teams, the tactic is to meter the expensive path—generation and high‑resolution processing—while bundling low‑cost features like prompts, presets, and collaboration.
If your pipeline includes 3D, consider separating asset access from compute. Let teams browse a curated library, such as our free 3D model catalog, and charge credits only when rendering or baking outputs.
Churn risk and pricing shock
Price increases are tempting in a hot market, but elasticity bites. An analytics study in 2026 linked large jumps in per‑transaction cost—over 150%—to the highest churn pockets. After fee changes, most acquisition channels weakened while referrals held up best.
Translation: abrupt fee moves can burn trust, stall growth loops, and sharpen competitor comparisons. Communicate early, give grace periods, and pair any price change with clear product wins.
Where AI is involved, cap surprise by showing unit economics inside the product. Display estimated credit drawdowns before a run, nudge to batch jobs, and auto‑route to cheaper models when quality allows.
What scales—and what breaks—in 2026
Scalable moves in 2026 share a logic: align price with value moments and reduce decision friction.
Scales
- Bundled suites that replace multiple tools while lowering total effective take.
- Seat plus usage for AI features, with transparent calculators and soft caps.
- Annual plans that lock price for 12 months while granting upgrade flexibility.
- Credits earmarked for expensive actions like renders, with rollover to limit waste.
- Co-marketing or distribution perks tied to higher tiers that demonstrably raise GMV.
Breaks
- Opaque fee stacks where rev-share, processing, and app store take all bite at once.
- Credit systems with fuzzy units that mask the real cost of generation or storage.
- Feature gating that blocks core collaboration, forcing shadow tools and extra spend.
- Sudden price hikes without roadmap proof, benchmarks, or migration support.
- Paywall sprawl across community, courses, and downloads that fragments conversion.
When teams prototype campaigns with reusable 3D assets from our free 3D model downloads, bundling asset access with collaboration often beats per‑file tolls.
Quick Checklist
- Map total take rate: platform, processing, app store, taxes, payouts.
- Price the AI path: meter generation, cap overages, publish calculators.
- Bundle to replace tools, not add them; show consolidated ROI clearly.
- Offer annual commitments with upgrade flexibility and rollout‑proof grace periods.
- Pilot with 50 users before global changes; measure churn and channel health.
- Separate asset access from compute; use credits only for expensive steps.
- Give migration guides, data export, and referral rewards during price shifts.
FAQ
How do I compare subscription versus take rate?
Start with your forecasted GMV and message volume. Model a year of payouts under each option, including processing, currency, app‑store fees, and software seats. Then stress‑test a 2x scenario to see where margin compression or overage pain shows up.
What’s a sensible AI pricing starter?
Use seats for collaboration and governance, with a modest included credit pool. Meter expensive actions, offer soft caps, and enable rollover. Publish a live usage dashboard so teams predict spend and tune prompts, batching, or model selection before bills spike.
How do fee hikes affect churn?
In 2026 analysis, the steepest per‑transaction increases correlated with the highest churn segments. Minimize shock with advance notice, phased rollouts, and clear product wins. Tie increases to measurable improvements like deliverability, discovery, or conversion, and keep referral incentives intact.
Where do 3D pipelines change pricing math?
Treat assets and compute separately. Let teams access libraries—such as our 3D model catalog—without charges, and meter only expensive steps like high‑res rendering or physics. This keeps experimentation cheap while aligning spend to production‑grade outputs.
Conclusion
Pricing in the creator economy rewards clarity, alignment, and restraint. Anchor bills to value moments, 2
Sources
- Creator Economy Market Research Report 2034
- How beehiiv Built a High-Growth Pricing Strategy for the Creator Economy
- Creator Economy Market Size, Share | Industry Report, 2033
- Best Creator Platform in 2026 | Earn From Your Content - Behind the Scenes
- Impact of Platform Fees on Revenue, Usage & Churn:Case Study
- Global Creator Economy Market Size and Forecast, 2026-2033
- Pricing Information for SaaS Platforms 2026 | InfluenceFlow
- 2026 Trends From Cataloging 50+ AI Pricing Models | Metronome blog
- AI Pricing: What's the True AI Cost for Businesses in 2026?
- Patreon vs Ko-fi vs Bandcamp vs Substack 2026 (Musicians) | Chartlex
- The Great Patreon Reset, and Where Creators Are Going: a Patreon vs Passes vs Substack vs Mighty Networks Comparison | MEXC News
- Patreon vs Talkspresso 2026: Fee Comparison for Creators
Ready to Get Started?
Explore production-ready 3D models for your next project. Browse the 3D model catalog to download assets you can use right away.
Turn this workflow into real deliverables
Browse production-ready 3D models for your next project, then step into 3d modeling if you need a custom build.